Overview
Introduction
Low-complexity, repetitive protein sequences with a limited amino acid palette are abundant in nature, and many of them play an important role in the structure and function of certain types of proteins. However, such repetitive sequences often do not have rigidly defined motifs. Consequently, the identification of these low-complexity repetitive elements has proven challenging for existing pattern-matching algorithms. SubSeqer (http://compsysbio.org/subseqer/) which uses graphical visualization methods borrowed from protein interaction studies to identify and characterize repetitive elements in low-complexity se-quences. Given their abundance, we suggest that SubSeqer repre-sents a valuable resource for the study of typically neglected low-complexity sequences.
The Algorithm
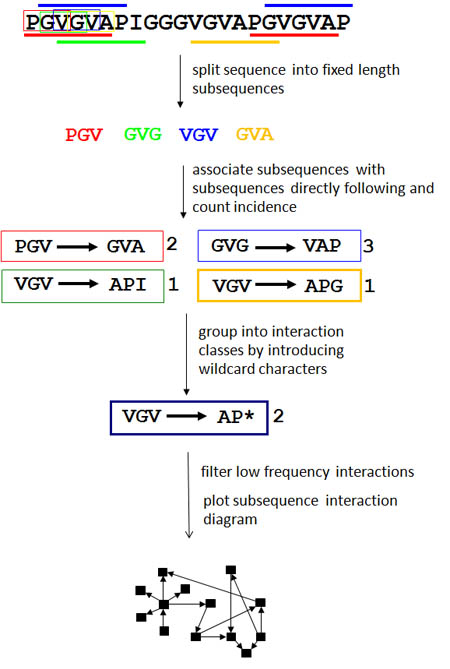 For a given sequence, the software first partitions it into overlapping subsequences of a fixed size using a sliding window (e.g. a sliding window of size 3 on a protein PGVGVG will produce the sequences PGV, GVG, VGV, GVG). Each subsequence is paired with its immediate in-frame downstream neighbor (e.g. using the same hypothetical protein, the subsequence PGV will be paired with GVG). Together, this pair of in-frame adjacent subsequences forms an interaction where two nodes, each representing one of the subsequences, are connected by a directed edge representing the adjacency and order of the subsequence pair. Wild-card characters representing any character are then introduced such that two similar, but not necessarily identical subsequence pairs which were each observed once (e.g. APG->VGG and GPG->VGV) would become a twice-observed subsequence pair (*PG->VG*). This step groups subsequence pairs into classes and allows the creation of more flexible patterns with a resulting amplified signal.
For a typical protein sequence, these steps will produce an intractably large number of fuzzy subsequence pairs which cannot be meaningfully visualized. In order to present only the most statistically abundant motifs, the software filters out subsequence pairs which are seldom present as well as those which are merely the result of sequence composition. For each pair of subsequences, an Odds Score is assigned that is proportional to the number of times each subsequence is observed relative to the total number of subsequences. It is found by -ln((s*t)/n^2), where s and t are the number of times the first and second fuzzy subsequences in the pair are observed, and n is the total number of subsequences (whose sizes are specified in the 'Subsequence size' parameter) found in the sequence. The lower the Odds Score, the higher the odds that the subsequence pair did not occur randomly. Only subsequence pairs with an odds score in the top X percentile are used in the final visualization, ensuring that only significant interactions are included in the analysis. This value X is the Percentile Odds Score Cutoff. By default, it is set to 2, which means that each subsequence pair chosen for the final network visualization has an Odds Score greater than 98 percent of the other subsequence pairs.
Finally, the software constructs a network in which the nodes represent common subsequences connected by edges representing the adjacency of the two subsequences. The thickness of each edge is weighted based on the number of times that particular interaction is observed relative to the length of the entire sequence. The resulting graphs are visualized using an interactive Java Applet. The representation of motifs as adjacent subsequence pairs often reveals prominent hub sub-sequences which form the integral parts of key motifs.