Documentation
Step 1: Sequence Input and Parameter Selection
SubSeqer can accept as input both nucleotide and protein sequences. In Step 1, users are presented with a window to enter their sequence of interest in FASTA format.
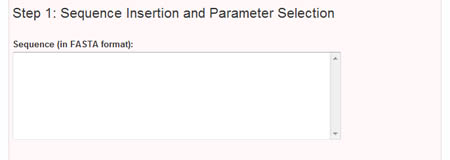
Once the sequence has been pasted into the input window, the user can select from two methods of inputing the required parameters.
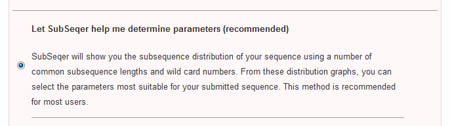
Let SubSeqer help me determine paramters
This method is recommended for new users of SubSeqer. It will show the distribution of the subsequences of a given sequence. More information about how the parameters are chosen based on these distritrubtions can be found in the section on Parameter Refinement. By default, the radio checkbox beside this method is checked, and the user need only click on the button 'Next step >' to proceed with the rest of the process.
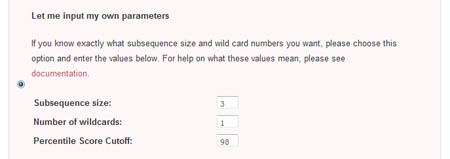
Let me input my own parameters
The second method of parameter input allows the user to directly enter his desired paramters. To do so, he must select the radio checkbox beside the 'Let me input my own parameters' section.
- Subsequence size
This is the size of the sliding window that is used to create subsequences from the initial sequence. Larger subsequence sizes give fewer nodes, but may not be good at detecting small motifs. Conversely, sliding windows that are too small will produce an intractable number of nodes, increasing the difficulty of detecting a real motifs - Wildcard number
This is the number of wildcard characters allowed in the subsequences. Increasing the number of wildcard characters decreases the number of subsequence types, but gives more flexible motifs. However, introducing too many wildcard characters may result in motifs with very little information - Percentile Odds Score Cutoff
For each pair of subsequences, an Odds Score is assigned that is proportional to the number of times each subsequence is observed relative to the total number of subsequences. It is found by -log((s*t)/n^2), where s and t are the number of times the first and second fuzzy subsequences in the pair are observed, and n is the total number of subsequences (whose sizes are specified in the 'Subsequence size' parameter) found in the sequence. The lower the Odds Score, the higher the odds that the subsequence pair did not occur randomly. Only subsequence pairs with an odds score in the top X percentile are used in the final visualization, ensuring that only significant interactions are included in the analysis. This value X is the Percentile Odds Score Cutoff. By default, it is set to 2, which means that each subsequence pair chosen for the final network visualization has an Odds Score greater than 98 percent of the other subsequence pairs.
Once these values are filled in, the user can press the 'Next step >' button to be taken directly to Step 3: Network Visualization
Step 2: Parameter Refinement (Optional)
This step is necessary only if the user chose to let SubSeqer help with determining a suitable parameter set from the previous step. The user's input sequences is processed into overlapping sub-sequences using a fixed-size sliding window. These subsequences were collated, and ordered or ranked according to how frequently they were observed. For example, a subsequence with rank 1 would be the most commonly observed sub-sequence within the input sequence. Using this ranked list of subsequences, SubSeqer plots a series of graphs (subsequence abundance rank on the x-axis and number of times the subsequence is observed on the y-axis) based on different sliding window and wildcard values.
Low-complexity proteins typically have distribution graphs with a small number of frequently observed subsequences followed by a steep drop. If the user input sequence generates a rather flat graph, it is most likely not a low-complexity sequence and SubSeqer should not be used. For low complexity sequences, choose the subsequence size and wildcard number which produces the most number of highly ranked subsequences before a sharp dropoff. For instance, out of the 4 graphs generated using different parameters shown below, the graph produced using a subsequence size of 4 with 2 wildcard produces the most desirable distribution.
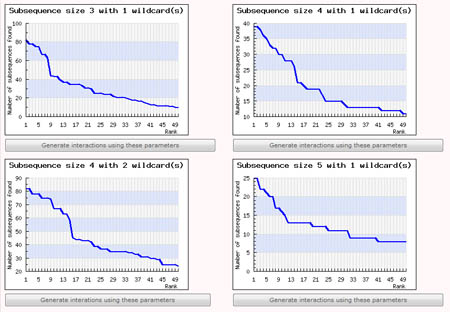
To create the subsequence network diagram, simply click on the 'Generate interactions using these parameters' button below the corresponding graph. The Percentile Score Cutoff for graphs generated using this method is set to the top 2 percentile by default. It can be changed during the Network Visualization step
Step 3: Network Visualization
The Network Visualization component of SubSeqer is a Java applet which presents the subsequence adjacency network to the user in an interactive manner.
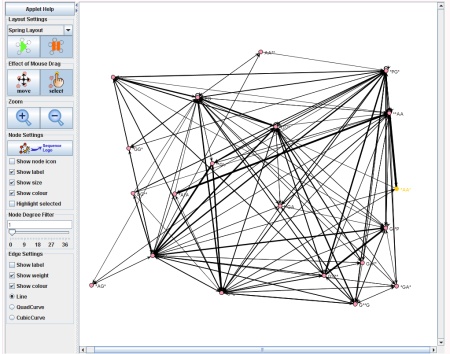
Canvas, Node, and Edge Manipulation
There are two states for the mouse cursor to exist at any given time. To move the canvas around, press the 'move' button. When the applet starts, this is the default state. While in this state, clicking on any region of the network and dragging the mouse will move the canvas. To enter the select state, click on the 'select' button. Select individual nodes, click on the desired node and it will be highlighted in yellow. To select multiple nodes hold the 'shift' key and select the desired nodes.- scroll the center wheel in both modes: zoom in and zoom out of the network in respect to the location of the mouse.
- shift + click in select mode: select or unselect multiple nodes one at a time.
- ctrl + click in select mode: select a node and center the entire network around that node.
- shift + drag in move mode: rotate network.
- ctrl + drag in move mode: stretch network.
To label the nodes with the subsequence or edges with the Odds Score, select the 'show label' tick boxes in the 'Node Settings' and 'Edge Settings' areas. To hide nodes with few connections, click and drag the 'Node Degree Filter' tool to the right.
Layout
Users can choose to see the nodes arranged using a number of different layout methods by selecting the desired method from the dragdown menu. The available choices are Kamada-Kawai layout, Fruchterman-Reingold layout, Circle layout, Spring layout, and I.S.O.M. layout. Each layout method has its own advantages and disadvantage. Some are suited for small size graphs, others perform better with larger size graphs. It is up to the users to find a suitable layout for their networks. However, two of the most widely used layouts are Fruchterman-Reingold and Kamada-Kawai.
The Fruchterman-Reingold layout method is based on the spring layout method, which introduces attraction forces between linked nodes and repulsion forces between unlinked nodes. All edges are treated as springs, so that the network will oscillate until a minimum force between nodes is reached. However, due to crossed edges in the network, the network may be trapped within a local minimum. Therefore, the spring algorithm in not guaranteed to find the best layout. Another problem with spring oscillation is that it may never finish. The Fruchterman-Reingold layout algorithm overcomes this problem by introducing a temperature system. During each iteration of the algorithm, the temperature is reduced and when the minimum temperature is reached, the algorithm stops. The Kamada-Kawai layout algorithm makes use of energy models. There are many energy models, but the principle is the same. All energy models attempt to combine different attributes of good layouts into mathematical formulas so that the global minima of the formulas represent the best layout solutions. Kamada-Kawai algorithm tries to find the minimum of its energy model by performing Newton's method with two variables. Rather than layout the network as a whole as in the Fruchterman-Reingold algorithm, each iteration in the Kamada-Kawai algorithm changes the position of only a single node.
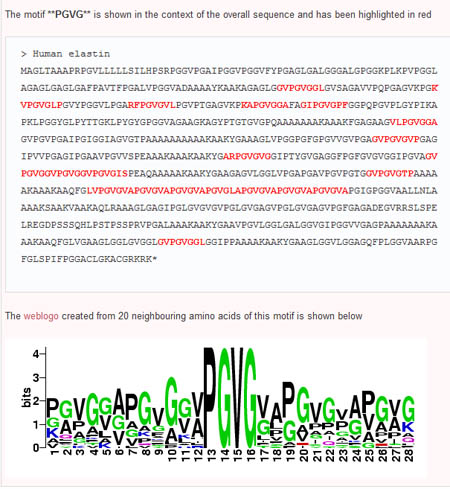
Step 4: Building Logos
To expand on potential motifs, users are able to build sequence logos based on the interested motif and 20 neighbouring amino acids. To do so, the user simply selects a pair of adjacent subsequences (nodes connected by an edge) in the order they appear in the sequence (ie the first node selected must have an edge pointing toward the second node). This can be done by first clicking the 'select' button, then holding down the 'Shift' key while selecting both nodes. Once the nodes are selected, the user can then click on the 'Sequence Logo' button and see the sequennce logo of the region surrounding the desired motif.