Documentation
Due to the use of Canvas in HTML5, while PhyloPro is optimized for Firefox 3.1+, Chrome 2.0+, Safari 4.0+, Opera 10.50+, and IE 9.0+ - earlier version browsers will have only limited functionality with the visualization interface.
Quick Search
Phylopro offers a quick search capability where users simply enter sequence IDs directly into a text box, and need only click on the button 'GO' to immediately obtain a clustered orthology heatmap derived using default parameters and options (all available 120 Eukarya are included as target species and Euclidean distance with complete linkage are used for clustering. This method is recommended for new users of PhyloPro. Note there is an upper limit of 1000 query sequences.
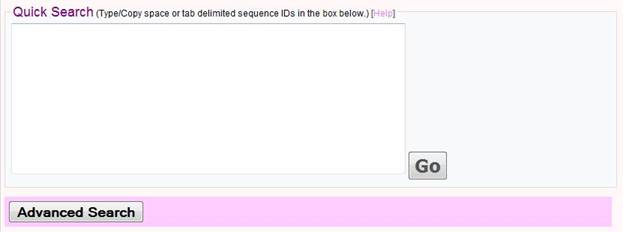
Format of Sequence IDs
The sequence IDs can include gene symbols (e.g. for worm 'mek-2'), entrez gene IDs (e.g. '171872'), protein IDs (e.g. 'CE25437'), ORF names (e.g. 'Y54E10BL.6'), or other organism specific terms (e.g. 'WBGENE00003186'). Details can be found by clicking the 'Help' link above the text box. If you don't have gene identifiers that match any of our options you can try using the Synergizer database to translate to e.g. entrez gene ID's.
Advanced Search
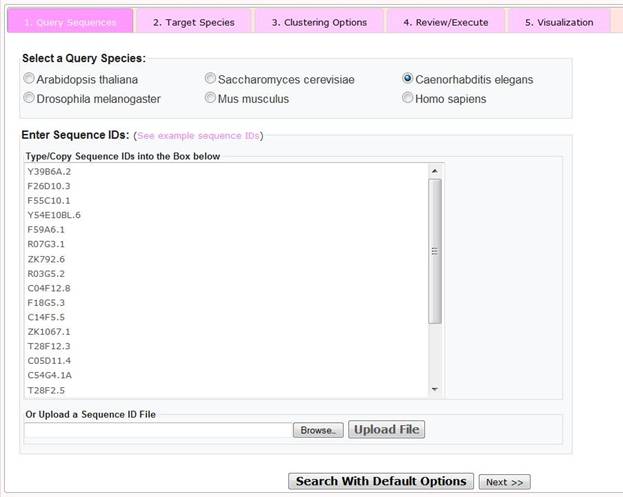
Step 1 Query Sequences
To select user-specific parameters and options, please click on the 'Advanced Search' button, after which the user is presented with a window, with radio buttons to indicate the sources (species) of the query sequences and a text box in which to enter sequence IDs. Alternatively, the user may upload a previously generated space- or tab-delimited file of sequence IDs. As for the 'Quick Search', there is a limit of 1000 query sequences that may be entered.
Once the sequence IDs has been pasted or uploaded, the user can choose to click the 'query with default options' button (in which case a clustered orthology heatmap is generated using the default options indicated under the quick search section) or the user may click on the 'next>>' button to go to the next user defined step.
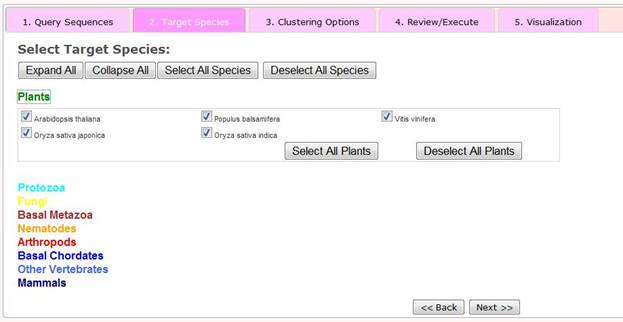
Step 2 Selection of Target Species
Available 164 eukaryotic species have been defined into nine established taxonomic categories: plants, protozoa, fungi, basal metazoa, arthropods, basal chordates, vertebrates and mammals. Users can select sets of target species by using the series of presented drop down menus and check boxes. Alternatively they can select all 164 species by clicking the 'Select All Species' button. For each taxonomy group, users can select all species in the group or deselect them by clicking, for example for Plants, the 'Select All Plants' or 'Deselect All Plants' buttons.
Once the target species have been selected, the user can click the 'next>>' button to go to Step 3 - Selection of clustering options.
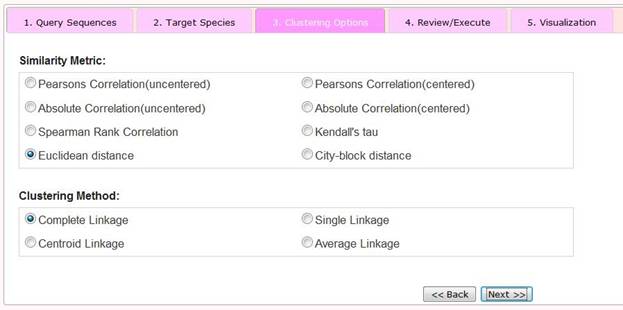
Step 3 Selection of Clustering Options
To hierarchically cluster derived phylogenetic profiles we apply the software Cluster3.0 (Eisen, et al., 1998) In this step, users can choose two parameters, the Similarity Metric and the Clustering Method.
The Similarity Metric option refers to how similarity (or alternatively, distance) between phylogenetic profiles is measured. Cluster3.0 features eight options. The basic idea of hierarchical clustering is to assemble a set of items into a tree, where items are joined by very short branches if they are very similar to each other, and by increasingly longer branches as their similarity decreases (Eisen, et al., 1998) . Cluster3.0 performs four types of binary, agglomerative, hierarchical clustering: centroid, single, complete or average linkages. Different methods refer to different ways to join branches and can result in different clustered outputs. More details of clustering options can be found in (Eisen, et al., 1998) .
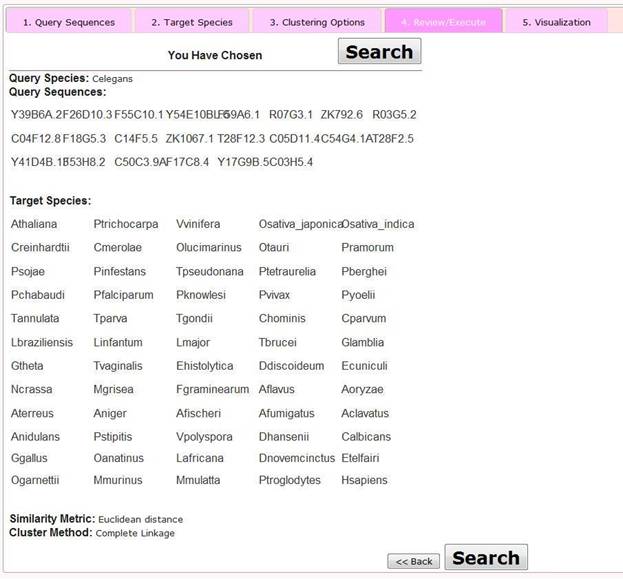
Step 4 Review/Execute the Query
At this step, users are presented with a review page showing the selected options. By clicking the 'Search' button, users then proceed to the visualization page. Alternatively by clicking the 'Back' button, the user may modify aspects of their query.
Step 5 Visualize the Clustered Phylogenetic Profiles
At this stage users are presented with a visualization of their results which features an interactive heatmap of orthology relationships.
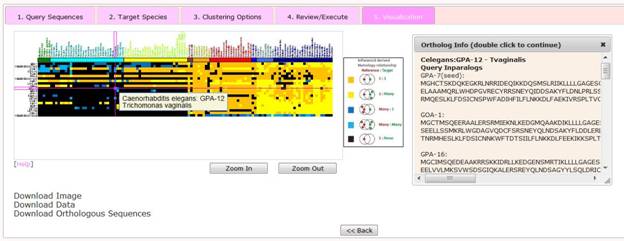
The horizontal axis in the heatmap represents 120 eukaryotes (i.e. target species) in a predefined order, i.e. plants --> protozoa --> fungi --> basal metazoa --> arthropods --> basal chordates --> vertebrates --> mammals. Specific species order is presented under the statistic page. The vertical axis represents the query sequences submitted by the user. The order of query sequences is defined by the hierarchical clustering.
Within the heatmap, five different colors correspond to five possible homology relationship, respectively, as follows,
1) dark black: no detectable orthologs;
2) dark yellow: 1:1 match, i.e. a single query gene has a single ortholog in the target species;
3) light yellow: 1:M match, i.e. a single query gene has two or more orthologs in the target species;
4) dark blue: M:1 match, i.e. a query gene together with at least one additional paralog are orthologs of a single gene in the target species; and
5) light blue: M:M match, i.e. a query gene together with at least one additional paralog are orthologs of at least two orthologs in the target species genome.
Mousing over an individual tile in the heatmap reveals the name of the query sequence, the query species, the target species. Double clicking on a tile reveals a pop-up window which displays details of orthologs including gene names and the sequence of both the query and orthologous genes.
The heatmap figure can be downloaded as a PNG file by selecting 'Download Image' link. In addition, two buttons provide links to download data associated with the heatmap. 'Download Data' downloads a tab-delimited file which displays the type of orthologous relationships presented in the heatmap; 'Download Orthologous Sequences' downloads a FASTA formatted file listing all the orthologs and their sequences captured by the heatmap.
Caveats
It should be noted that there are a number of caveats associated with orthology detection (Kuzniar, et al., 2008; Rano-Rubio et al. 2009). Firstly, in the absence of detailed phylogenetic analyses, domain gains, losses and shuffling events can significantly complicate orthology assignments. Secondly, horizontal gene transfer introduces an additional problem of xenologs which can lead to confounding outcomes. Thirdly, the quality and coverage of genome annotation varies significantly between genome projects. Genomes or lower quality or with lower fold coverage may be associated with incomplete proteomes, giving rise to apparently missing orthologs. Here we have attempted to use published genomes that provide a good compromise between phylogenetic coverage and what we consider are useful genome assemblies. As more genomes are sequenced, there is an increasing recognition for a set of 'industry' standards to be defined (Chain et al., 2009). Given this recognition, we expect that future updates of PhyloPro be able to exploit more comprehensive sources of 'standardized' genome assemblies that provide comparable accuracies and coverage. On the other hand, one of the strengths of PhyloPro is the ability to visualize relationships across many related species, providing an indication of consistency of orthology assignment.
Related Work
Aside from using phylogenetic profiles to predict gene function prediction (Pelligrini et al., 1999; von Mering, et
al., 2007), a number of online tools have been developed to allow users to explore and visualize phylogenetic profiles.
PhyloPat (Hulsen, et al., 2009) is a web browseable database that allows users to retrieve phylogenetic profiles of
specified genes as well as identify genes with defined phylogenetic profiles. Orthologous relationships are based on the
Ensemble ortholog detection pipeline, which
combines BLAST-based reciprocal best hits with phylogenetic tree reconciliation. PhyloPat features gene neighbourhood views that enable the user to identify
syntenic relationships across genomes that provide further support for orthologous relationships. In addition,
PhyloPat provides the interesting function of being able to identify
genes with anticorrelated patterns suggesting analagous functions. Like PhyloPro, PhyloPat allows the input of several
sequences at once amd allows orthologs to be readily retrieved. On the other hand, PhyloPat is based on EnsMart and is largely
limited to vertebrates (46 species in all). Furthermore, it does not perform any clustering of profiles, which for relatively large
datasets, makes it difficult to capture lineage specific innovations in a single view.
OMAbrowser is another tool that provides access to sets of user defined orthologs (Schneider et al., 2007). OMAbrowser captures orthologous relationships from 830 species using
pairwise distance metrics. It isn't clear if more than one sequence can be input at a time, although the search box does
allow more generic search terms such as "photoreceptor" to be queried. Output is non-graphical and lists
only the orthologs of the queried genes. Consequently without significant additional processing, OMAbrowser does not provide readily comparable phylogenetic profiles
that can be clustered and used to readily infer evolutionary trajectories.
References
Chain PS et al Genome project standards in a new era of sequencing. Science. 2009 Oct 9;326(5950):236-7)
Eisen, M.B., et al. (1998) Cluster analysis and display of genome-wide expression
patterns, Proc Natl Acad Sci U S A, 95, 14863-14868.
Hulsen, T., et al. (2009) PhyloPat: an updated version of the phylogenetic pattern database contains gene neighborhood, Nucleic
Acids Res, 37, D731-737.
Kuzniar, A., et al. (2008) The quest for orthologs: finding the corresponding gene across genomes, Trends Genet, 24, 539-551.
Pellegrini, M., et al. (1999) Assigning protein functions by comparative genome analysis: protein phylogenetic profiles,
Proceedings of the National Academy of Sciences of the United States of America, 96, 4285-4288.
Ruano-Rubio, V., Poch, O. and Thompson, J. (2009) Comparison of eukaryotic phylogenetic profiling approaches using species tree
aware methods, BMC bioinformatics, 10, 383.
Schneider, A., Dessimoz, C. and Gonnet, GH. (2007): OMA Browser - Exploring Orthologous Relations across 352 Complete
Genomes, Bioinformatics 23(16), pages 2180-2182.
von Mering, C., et al. (2003) STRING: a database of predicted functional associations between proteins, Nucleic Acids Res, 31,
258 - 261.